Ask Oribi about your data
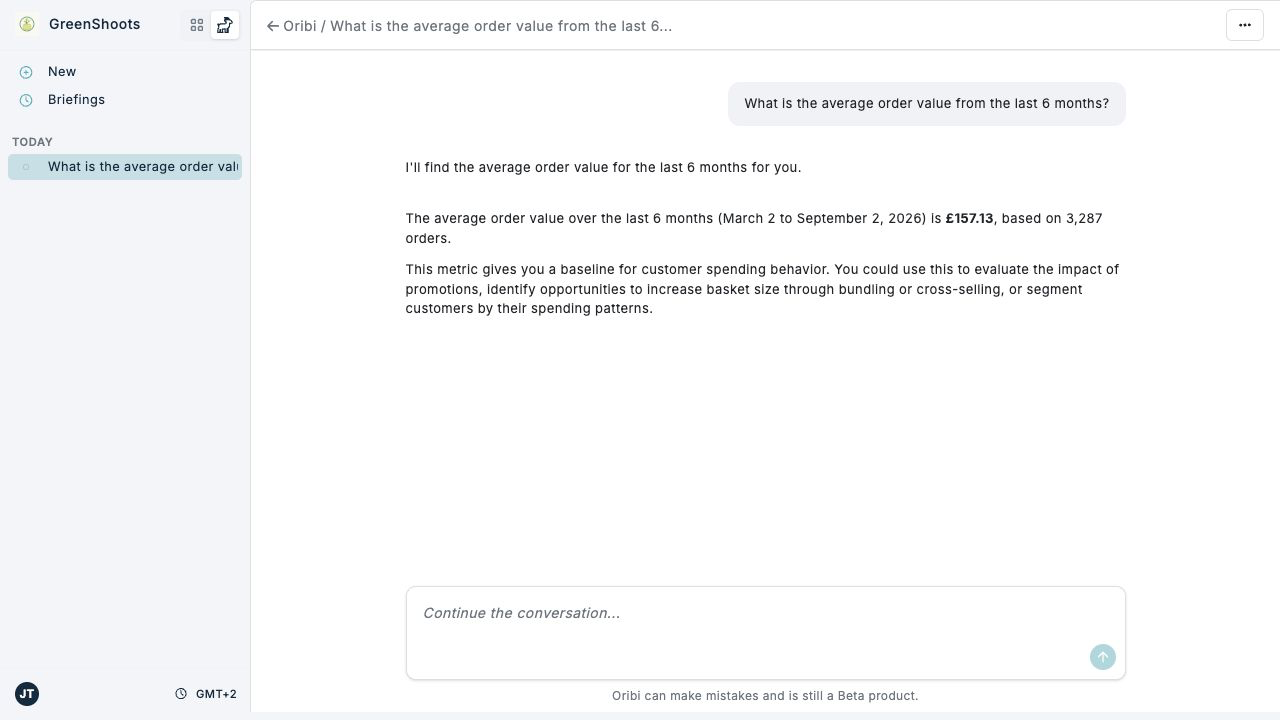
Use Ask Oribi to explore your business data in plain language. Start with your own question or choose a common question, then keep the conversation going when you want Oribi to explain or investigate the result further.
Expected result
- Oribi answers your question in a saved conversation.
- You can ask follow-up questions in the same conversation.
- The conversation appears in the Oribi navigation, grouped by its latest activity date, so you can reopen it later.
Ask Oribi in Console
- Open Ask Oribi. If the standard Console navigation is active, select the Oribi icon beside the current business and click New.
- Enter a question in Ask a question about your data, or choose one of the prompts under Common questions.
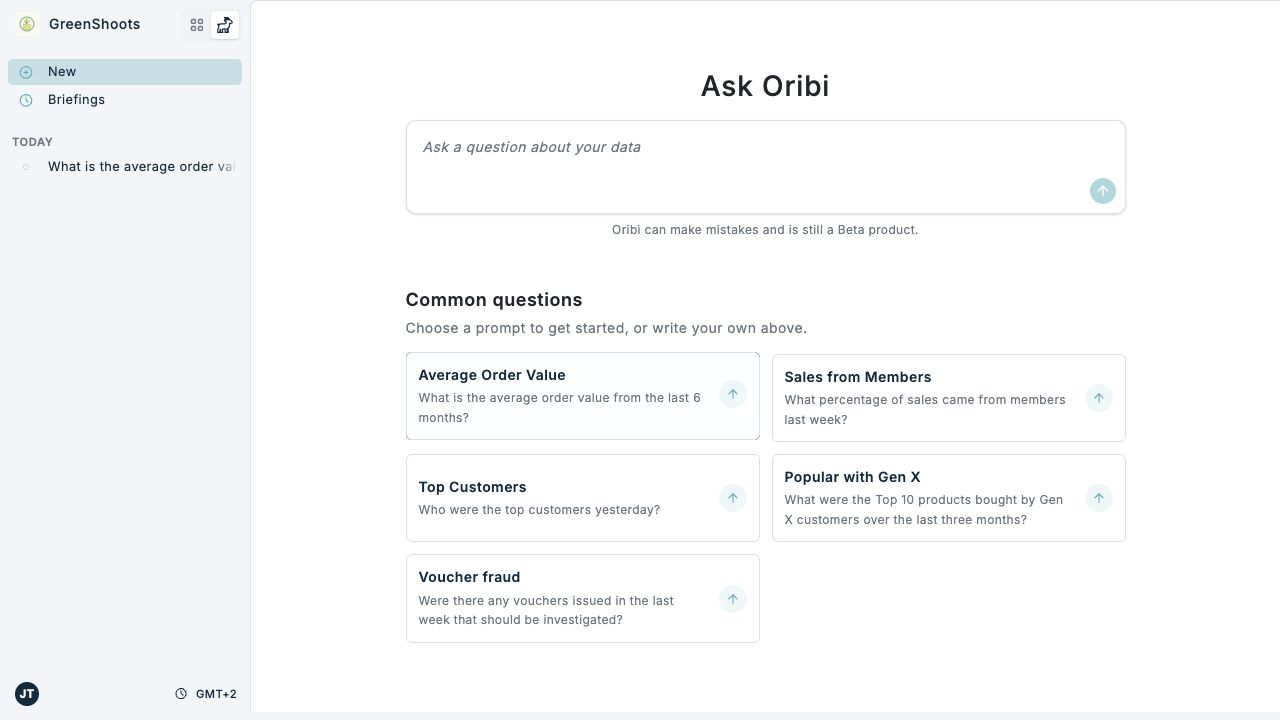
- Click Send message and wait for Oribi to finish analysing your data.
- Review the final response. Check that its period, scope, and business context match the question you intended to ask.
- To continue, enter another question in Continue the conversation and click Send message.
- To reopen the conversation later, select it from Today, Previous 7 days, Previous 30 days, or More than 30 days in the Oribi navigation.
- Click New whenever you want to start a separate conversation with a clean context.
Follow an analysis
The conversation navigation and Actions menu stay at the top while you scroll. The message box stays at the bottom, so you can write a follow-up while reviewing any part of the answer. Use Jump to latest to return to the end, or View response while Oribi is still working.
While Oribi works, its activity is expanded so you can follow its progress. When the response is ready, the activity collapses and the final answer remains visible. Click View activity to reopen the progress messages. If you open or interact with the activity during the analysis, it stays open.
Charts and tables remain visible with the response. Questions that need your answer and actions that need approval also stay visible. Product-sales tables show money and percentages with their formats, and preserve fractional quantities. Full-day comparison dates identify the last included day; a period ending at midnight on 27 September includes sales through 26 September.
For sales comparisons, read the reporting dates, stores and coverage notes alongside the figures. A completed measurement does not confirm that historical records are complete. Sales growth alone does not establish how much a campaign caused. Oribi can compare all-product purchases at the same stores over the same dates and check daily receipt presence when additional context is useful.
A Partial summary means Oribi stopped before completing the analysis. Read its findings and Data and coverage notes to see which measurements completed and what could not be verified. A partial summary can still include useful measured findings. An Analysis incomplete message means a reliable final summary could not be produced. You can inspect the activity and try again.
Read key figures
Some analytical answers highlight up to three Key figures near the start of the final response. These highlights focus on the main finding, such as a change or redemption rate, using measured values and calculations from those results. Simple answers may emphasize a number in the text instead.
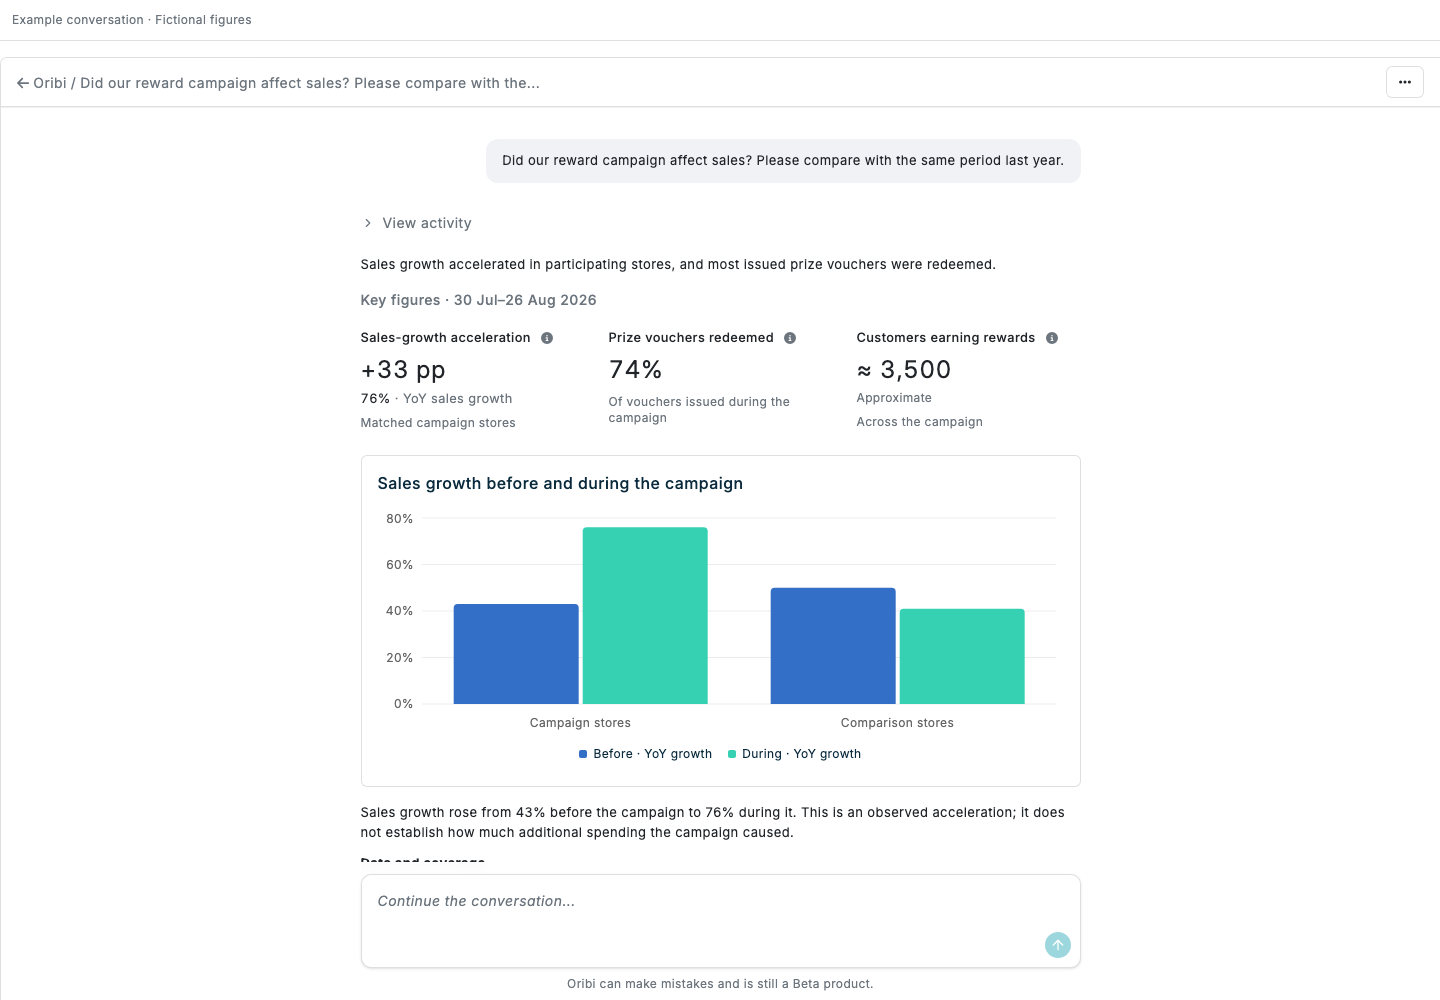
Read the short reporting context beneath the figures. Click the information icon beside a metric to see its definition, calculation and source details. pp means percentage points: a rise from 40% to 60% is an increase of 20 percentage points. Approximate identifies an estimated distinct count; Partial reporting period means the selected period is incomplete. Unavailable means the measurement is missing, not zero. A positive change does not by itself establish that a campaign caused the increase.
Key figures appear when the answer finishes, below the opening finding and alongside the main chart when one is available. When Oribi revises a chart during an answer, the revised version replaces its earlier version. Separate charts and charts from earlier answers remain visible. Key figures remain visible when you reopen the conversation or collapse its activity. Read the explanation and coverage notes alongside them.
Choose which redemptions to include
If you ask about redemptions without specifying a category, Oribi asks which data to include:
- Voucher redemptions excludes personal pricing.
- Personal pricing redemptions includes only personal pricing discounts applied to purchases.
- All redemptions combines both categories.
Choose a category before Oribi continues. You can also include the category in your original question, such as “Show voucher redemptions by store for the last four weeks, excluding personal pricing.” If you name a specific campaign, Oribi can use its campaign type to identify the category.
Oribi keeps your choice for follow-up questions in the same analysis, such as “Now show that by store.” To change it, name the new category. Results identify the category used; tables and charts drawn from those results also show it in a caption.
Download a conversation in the local environment
When both Console and Oribi run in the local environment, you can download a conversation for troubleshooting. This option is unavailable in staging and production. A local environment can still query production business data.
- Open the saved conversation and wait for Oribi to finish responding.
- Open the Actions menu (the three dots at the top of the conversation).
- Select Download conversation, in the same menu as Delete.
- Save the JSON file and share it only with people authorised to view the conversation's data.
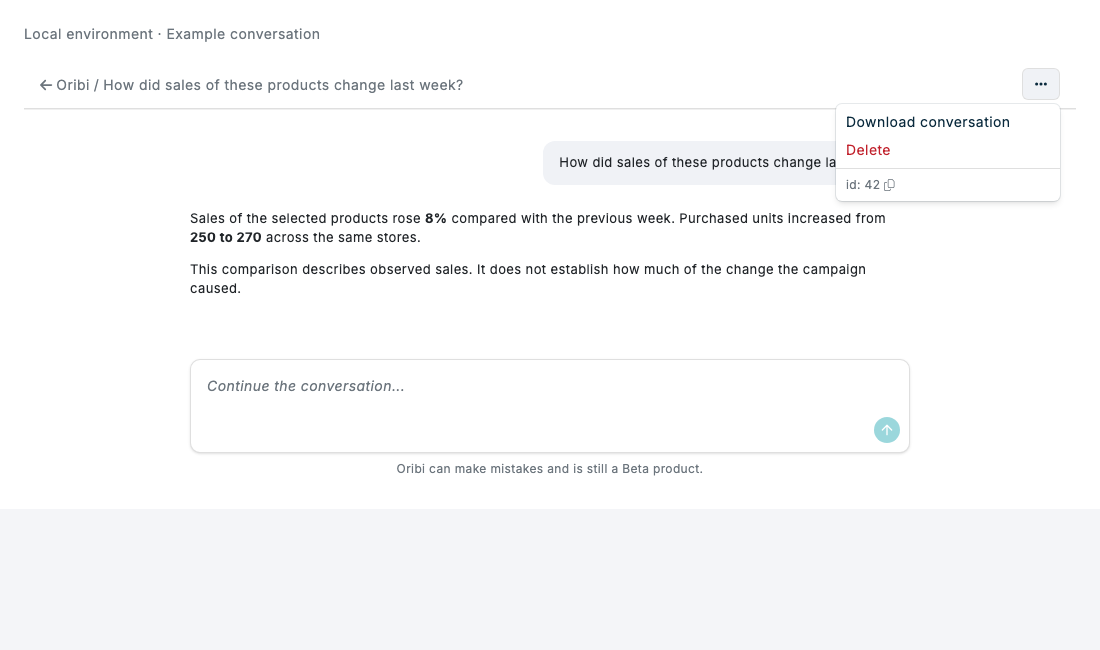
The download includes saved messages, tool requests and results where available, charts and tables, and records of questions and approvals. When a chart has been revised, the export preserves both versions for troubleshooting. It also identifies results that could not be fully stored. Model thinking is excluded, and known credential fields are redacted. The file can contain customer and business data; it is a troubleshooting record, not an anonymised report.
The export contains the saved conversation on the connected local Oribi server. It does not retrieve conversation history from production or recover results that were never stored.
If something looks different
- If the Oribi navigation is not available, ask your Spaaza administrator to confirm that your user has Oribi access. Contact Spaaza if Oribi still needs to be activated for your business.
- If a question returns an unexpected result, make the period, metric, or group more specific in a follow-up question.
- If Oribi is still analysing, keep the conversation open until the response completes. You can use View response if you scrolled away from the latest output.
- Oribi is a beta product and can make mistakes. Verify important figures before using them for a decision.