Reporting
The Reporting area in Console gives you two ways to work with report data. Use Realtime reports to open live Console reports with charts, KPIs, and tables on screen straight away. Use Downloadable reports to generate a file, then collect it later from Exports after processing finishes.
Open Reporting from the main navigation, then use the Realtime reports and Downloadable reports tabs at the top of the page to switch between the two report types.
Report types in Reporting
On-screen reports
Use Realtime reports when you want to explore loyalty programme performance immediately in Console. The primary reports match the dashboard sections on the home page, and each dashboard section links to its full report.
Primary loyalty reports include:
- Loyalty
- Levels
- Signups
- Baskets
- Top Customers
- Wallet Entries
- Vouchers
- Personal Pricing
Additional reporting pages are still available for more specific analysis, including:
- Store report
- Product performance
- Customer insights
- Referrals
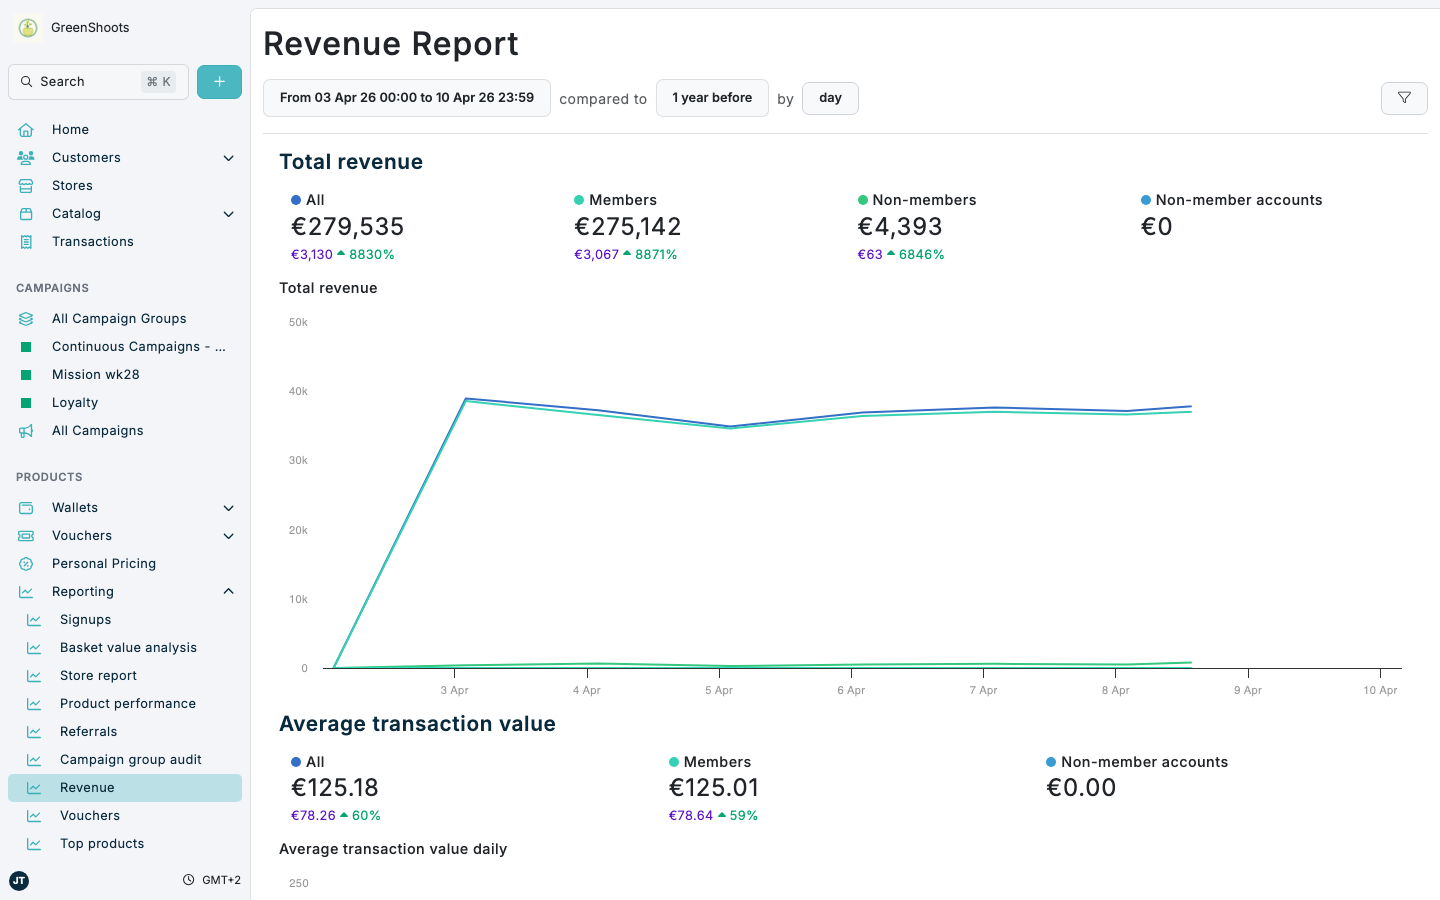
- Revenue
- Basket value buckets
- Top products
- Top categories
Open a chart in a large view
Use the large view when a chart or table needs more space, or when you want to keep its reporting context visible while reviewing it.
- Open a Realtime report and find the chart or table you want to review.
- Hover over the insight, then click Open in large view (below the information icon when one is available). On a touch device, the action icons remain visible.
- Review the context labels below the dialog title. They show the reporting period, comparison period, interval, and any selected business, region, format, country, channel, segment, or chart view associated with the displayed result.
- If the insight has tabs, use the tabs inside the dialog to change the view.
- Click the close icon or press Escape to return to the report.
Compare a trend with another period
Some single-metric trend charts show the comparison period as a dashed purple line alongside the solid selected-period line.
- Choose a reporting period and comparison period in the report filters.
- Read both lines from the start of their respective periods. Each daily point follows the reporting timezone, and the first comparison interval is aligned with the first selected interval even when the periods use different calendar dates.
- Hover over the dashed line to see the comparison value and its actual date.
- Open Open in large view to see the chart key, both exact date ranges, and the rest of the applied reporting context.
- For custom periods with different lengths, use the coverage note in the large view. Shorter comparison lines end naturally; longer comparison periods are not compressed to fit.
For average order value charts, dates without matching transactions have no average value. The chart connects the nearest available values across those dates instead of treating them as zero. When this occurs, the large view shows an explanatory note below the chart.
Some chains do not provide non-member sales data. Insights that require this data, including Member sales, Non-member AOV, and Number of items in non-member baskets, show Not available instead of an incomplete or misleading result.
Downloadable reports
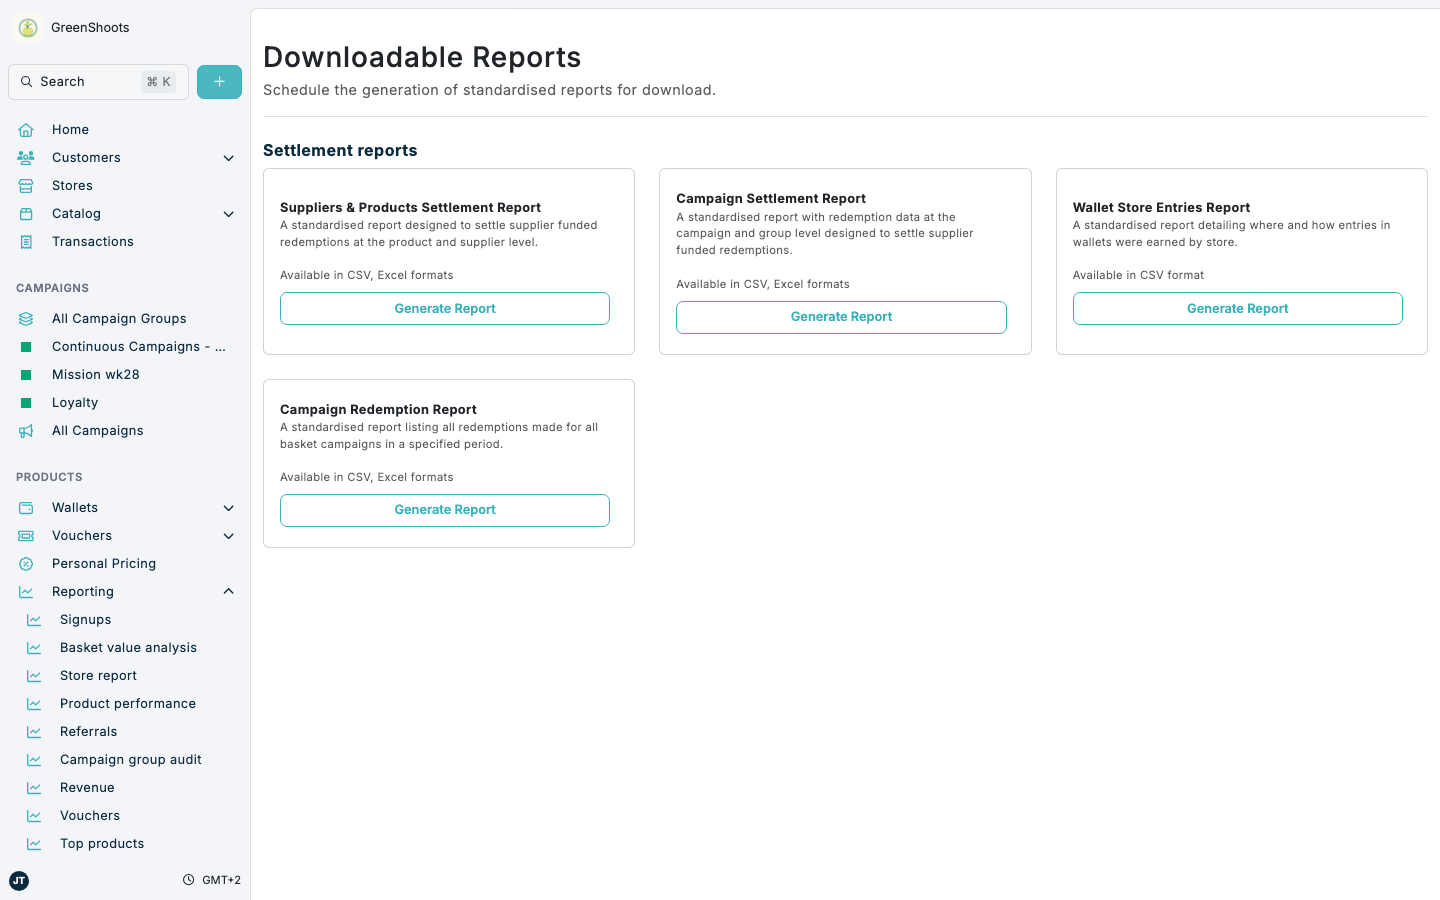
Use Downloadable reports when you need a standardised file rather than an on-screen view. This area includes options such as Suppliers & Products Settlement Report, Campaign Settlement Report, Wallet Store Entries Report, and Campaign Redemption Report.
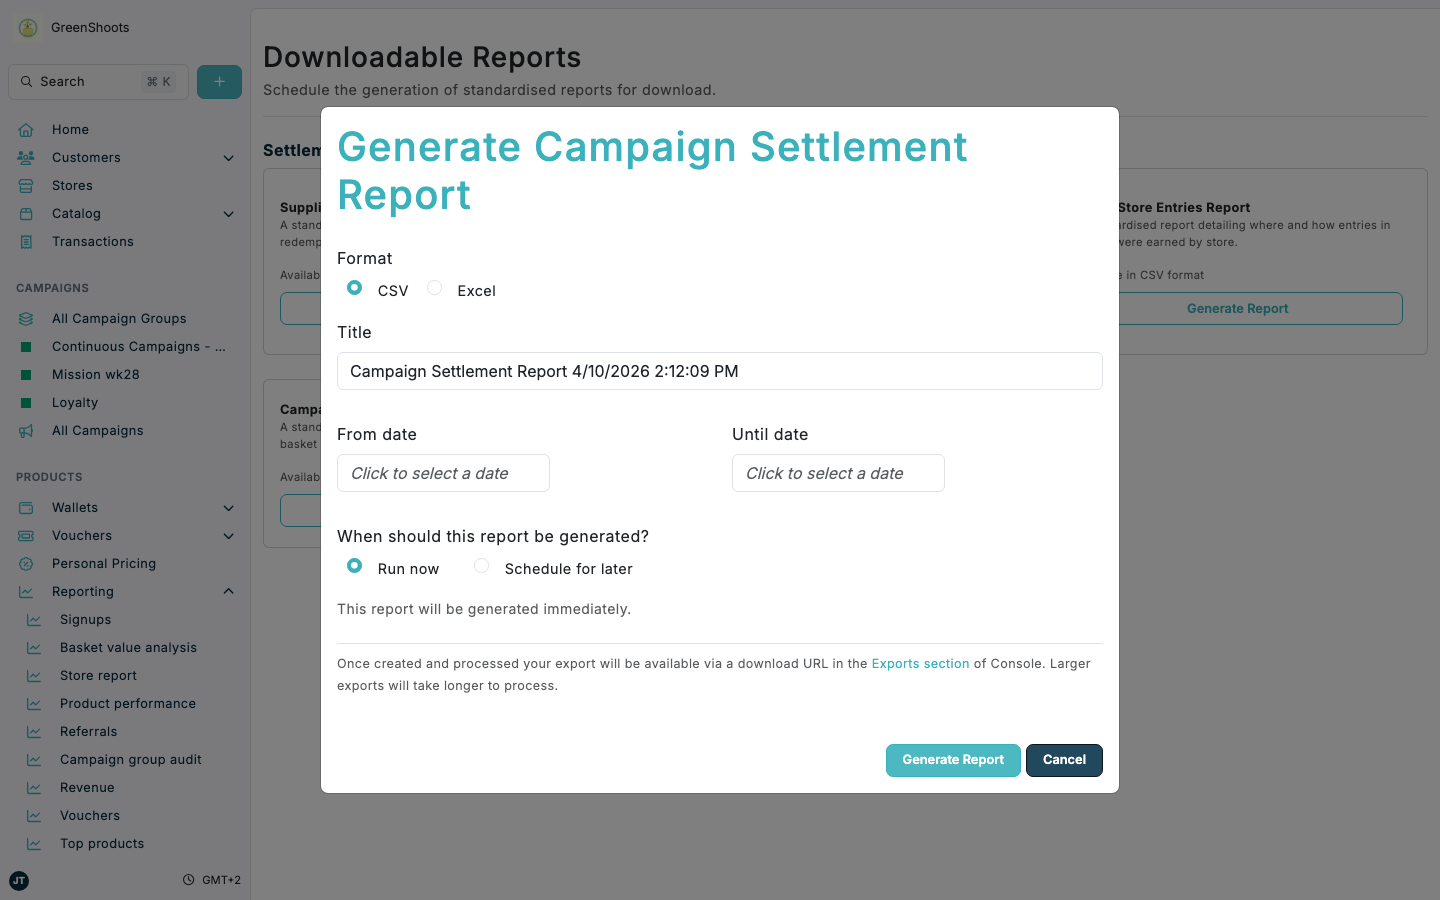
When you generate one of these reports, you choose the available format, set any date range or report-specific options, and either run it immediately or schedule it for later. Console confirms that the report task was created and provides a View exports shortcut. A green dot also highlights Exports in the main navigation. After the report has been processed, the finished file is available from Exports.