Transaction velocity
Transaction velocity measures how much of a customer's shopping is concentrated in time. It finds the busiest stretch inside a fixed period of recent history, and it counts how often such stretches come back.
Most loyalty measures describe how much a customer buys in total. Transaction velocity describes how tightly those purchases cluster together. A customer with 30 transactions spread over three months and a customer with 30 transactions in one week look identical on a transaction count. They look very different on transaction velocity.
How it is measured
Transaction velocity uses two different time spans. Keeping them apart is the key to reading these metrics correctly.
- The lookback period is the long span. It is the stretch of recent history the measurement examines, typically the last 91 days.
- The velocity window is the short span. It is a run of consecutive days, typically 5, that slides across the lookback period one day at a time.
- The velocity threshold is the number of transactions inside one window that counts as high velocity, typically 15.
A typical setup is therefore stated as 15 transactions within 5 consecutive days, measured across the last 91 days.
The short window slides across the whole lookback period
The window ends on each day of the lookback period that has a full 5 days behind it. With a 91-day lookback and a 5-day window, that gives 87 separate 5-day windows, not one.
The customer counts as high velocity when any one of those windows reaches 15 transactions. The windows overlap, so one busy stretch appears in several of them.
This does not mean the last 5 days. A common misreading is that the rule checks only the 5 days just gone. It does not. It checks every 5-day stretch inside the whole lookback period.
A customer who made 16 transactions in one week two months ago is high velocity today, even if they have not shopped since. The busy stretch stays visible for as long as it remains inside the lookback period.
The measurement looks backwards, and it is bounded
Transaction velocity is re-measured over the lookback period as it moves forward in time. It is not a total that grows as a customer keeps shopping.
Two consequences follow from this.
- A past burst eventually drops out. Once a busy stretch falls outside the lookback period, it no longer counts. A customer can therefore stop being high velocity without their behavior changing, simply because the burst grew too old.
- Every metric naming the lookback period covers only that period. Transactions in Lookback Period is the number of transactions inside it. It is not the customer's total number of purchases, and it does not match a lifetime transaction count.
Days are counted in your business's local timezone. A day with no transactions counts as a day with zero transactions, not as a gap in the data.
What the metrics tell you
The metrics divide into two groups. The first group describes the peak. The second group describes the surrounding behavior.
The peak and its bands
| Metric | What it means |
|---|---|
| Peak Transaction Velocity | The most transactions the customer made in any single window. |
| Peak Velocity End Date | The last day of the window that peaked. Use it to tell a burst last week from a burst two months ago. |
| High Transaction Velocity | Yes when the peak reached the velocity threshold. |
| Velocity Tier | A band over the peak, such as Normal, Elevated, High, or Extreme. |
| High Velocity Windows | How many of the windows reached the threshold, out of 87 in a typical setup. |
| High Velocity Window Share | The share of all windows that reached the threshold, from 0.0 to 1.0. |
| Velocity Persistence | A band over the number of high velocity windows, such as Single event, One stretch, Occasional, or Recurring. |
Velocity Tier and Velocity Persistence answer different questions. Use both together.
- A customer with one intense holiday shopping week has a high tier and a low persistence.
- A customer who shops intensely all year has a high tier and a high persistence.
Volume alone does not separate these two customers. The bands do.
The surrounding behavior
| Metric | What it means |
|---|---|
| Transactions in Lookback Period | Transactions the customer made inside the lookback period. |
| Active Days in Lookback Period | Days in the lookback period on which the customer transacted. |
| Avg Transactions per Day | Average transactions per day across the whole lookback period. |
| Avg Transactions per Active Day | Average transactions per day, counting only days on which the customer transacted. |
Use these metrics to put a peak in context. A high peak next to a low Active Days in Lookback Period describes a short burst. The same peak next to a high active-day count describes a steady heavy shopper.
Band values to use in a filter
The table shows a band as a readable label. A filter matches the stored value, which is written in lower case with underscores. Type the stored value, not the label.
| Velocity Tier shows | Type this in a filter |
|---|---|
| Normal | normal |
| Elevated | elevated |
| High | high |
| Extreme | extreme |
| Velocity Persistence shows | Type this in a filter |
|---|---|
| Single event | single_event |
| One stretch | one_stretch |
| Occasional | occasional |
| Recurring | recurring |
These are the usual bands. Your business can use a different set.
Where to find this in Console
Transaction velocity appears on the customer record, in the Customers area of Spaaza Console.
Filter customers by transaction velocity
- Open the Customers area.
- Click All filters.
- Select the Transaction Velocity group in the left menu.
- Click the metric you want to filter on.
- Set the operator and the value for the rule. For Velocity Tier and Velocity Persistence, type the stored value from Band values to use in a filter.
- In Match, select All or Any when you use more than one rule.
Expected result: the customer results refresh and show only the customers that match the rules.
To reuse the same audience later, click Save segment and give the segment a name. See Customer Segments.
A quick filter for High Transaction Velocity: Yes is available above the results. Click it to add that rule in one step.
Show transaction velocity as table columns
The velocity metrics are optional columns. They stay hidden until you select them.
- Open the Customers area.
- Click Columns.
- In Customise optional columns, type
velocityin Search columns. - Select the columns you want.
- Close the dialog.
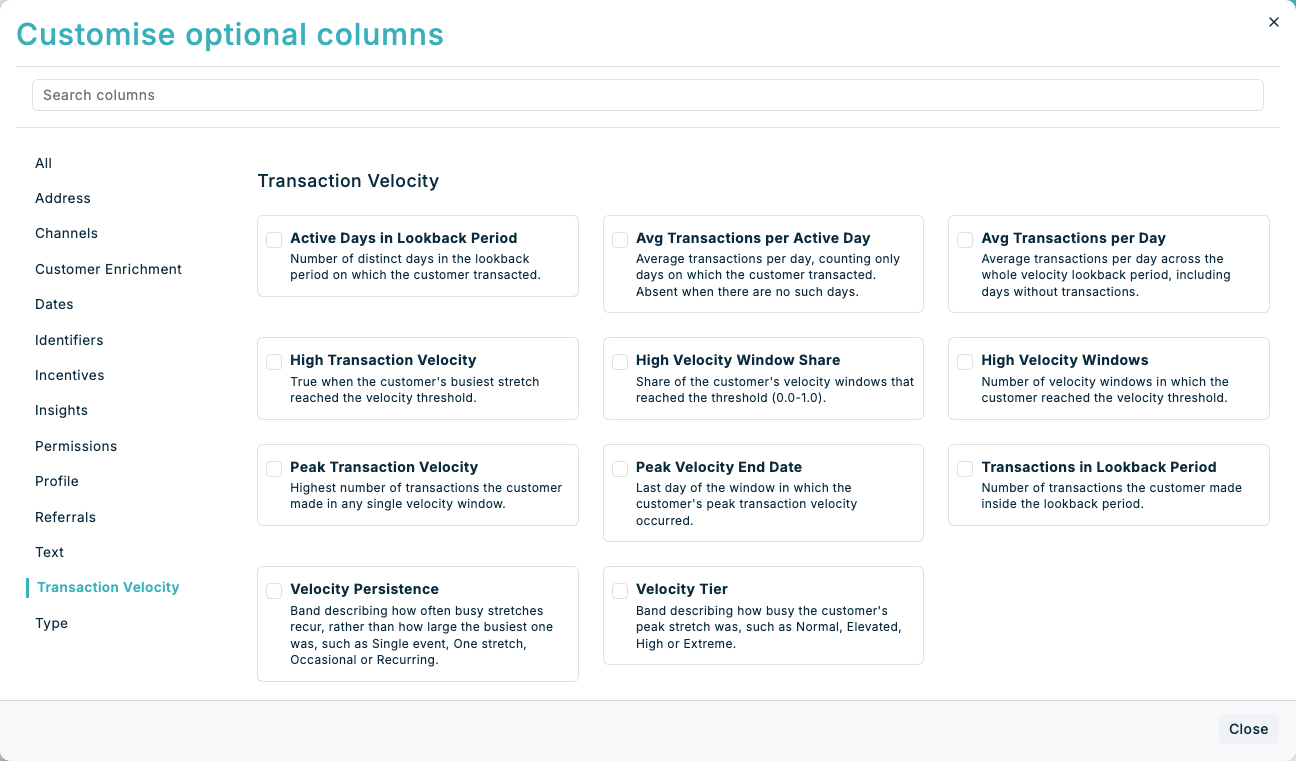
Expected result: the selected columns appear in the customer table.
Velocity Tier and Velocity Persistence show as labeled badges. High Transaction Velocity shows as Yes or No.
Export transaction velocity
All velocity metrics are available in customer exports. Filter the customer list first, then click Export. See Exporting Customers.
If something looks different
- If the velocity columns are not in Customise optional columns, clear Search columns and look for the Transaction Velocity group. Not every column in the group has Velocity in its name.
- If a filter on a velocity metric returns no customers, widen the rule. A high threshold matches very few customers.
- If Velocity Tier or Velocity Persistence is empty while the other velocity columns hold values, the customer falls below the lowest band.
Limits worth knowing
- Overlapping windows count one burst more than once. A single busy stretch appears in several windows, so High Velocity Windows is larger than the number of separate bursts. Read it as time spent above the threshold, not as a count of events.
- A quiet lookback period gives a zero peak. A customer with few or no transactions in the lookback period has no busy stretch to find. Their peak is zero and they fall below every band.
- Absent is not zero. When a customer has no velocity metrics, the columns show None. This means Spaaza did not measure velocity for that customer. It does not mean the customer has low velocity.
Related insights
- Customer enrichment — per-customer summaries of recent shopping behavior.
- Transaction outlier score — a per-transaction signal for transactions that stand out.